The Pizza Bakery
A pizza-kitchen guide to where your LLM server actually slows down.

With apologies to Leslie Lamport, who explained consensus through the parliament of an ancient Greek island. My subject is humbler (serving a language model), but I found I couldn’t reason about it until I’d turned it into a kitchen.
Disclaimer: Used Claude in drafting the blog. All ideas are mine but Claude helped me in communicating them better.
One caveat before we step into the kitchen. This analogy is not perfect, and I won’t pretend it is. A GPU is not really a room full of bakers. So as we go, I’ll call out where the analogy breaks down whenever it does. Treat the bakery as a map: handy for finding your way, not the territory itself.
The serving engine is a pizza bakery
Imagine the whole LLM serving setup as a pizza bakery. The kitchen is the serving engine (in my case, vLLM), the management that runs the whole operation. Crucially, the kitchen works across two rooms: a front desk on the CPU and the baking floor on the GPU.
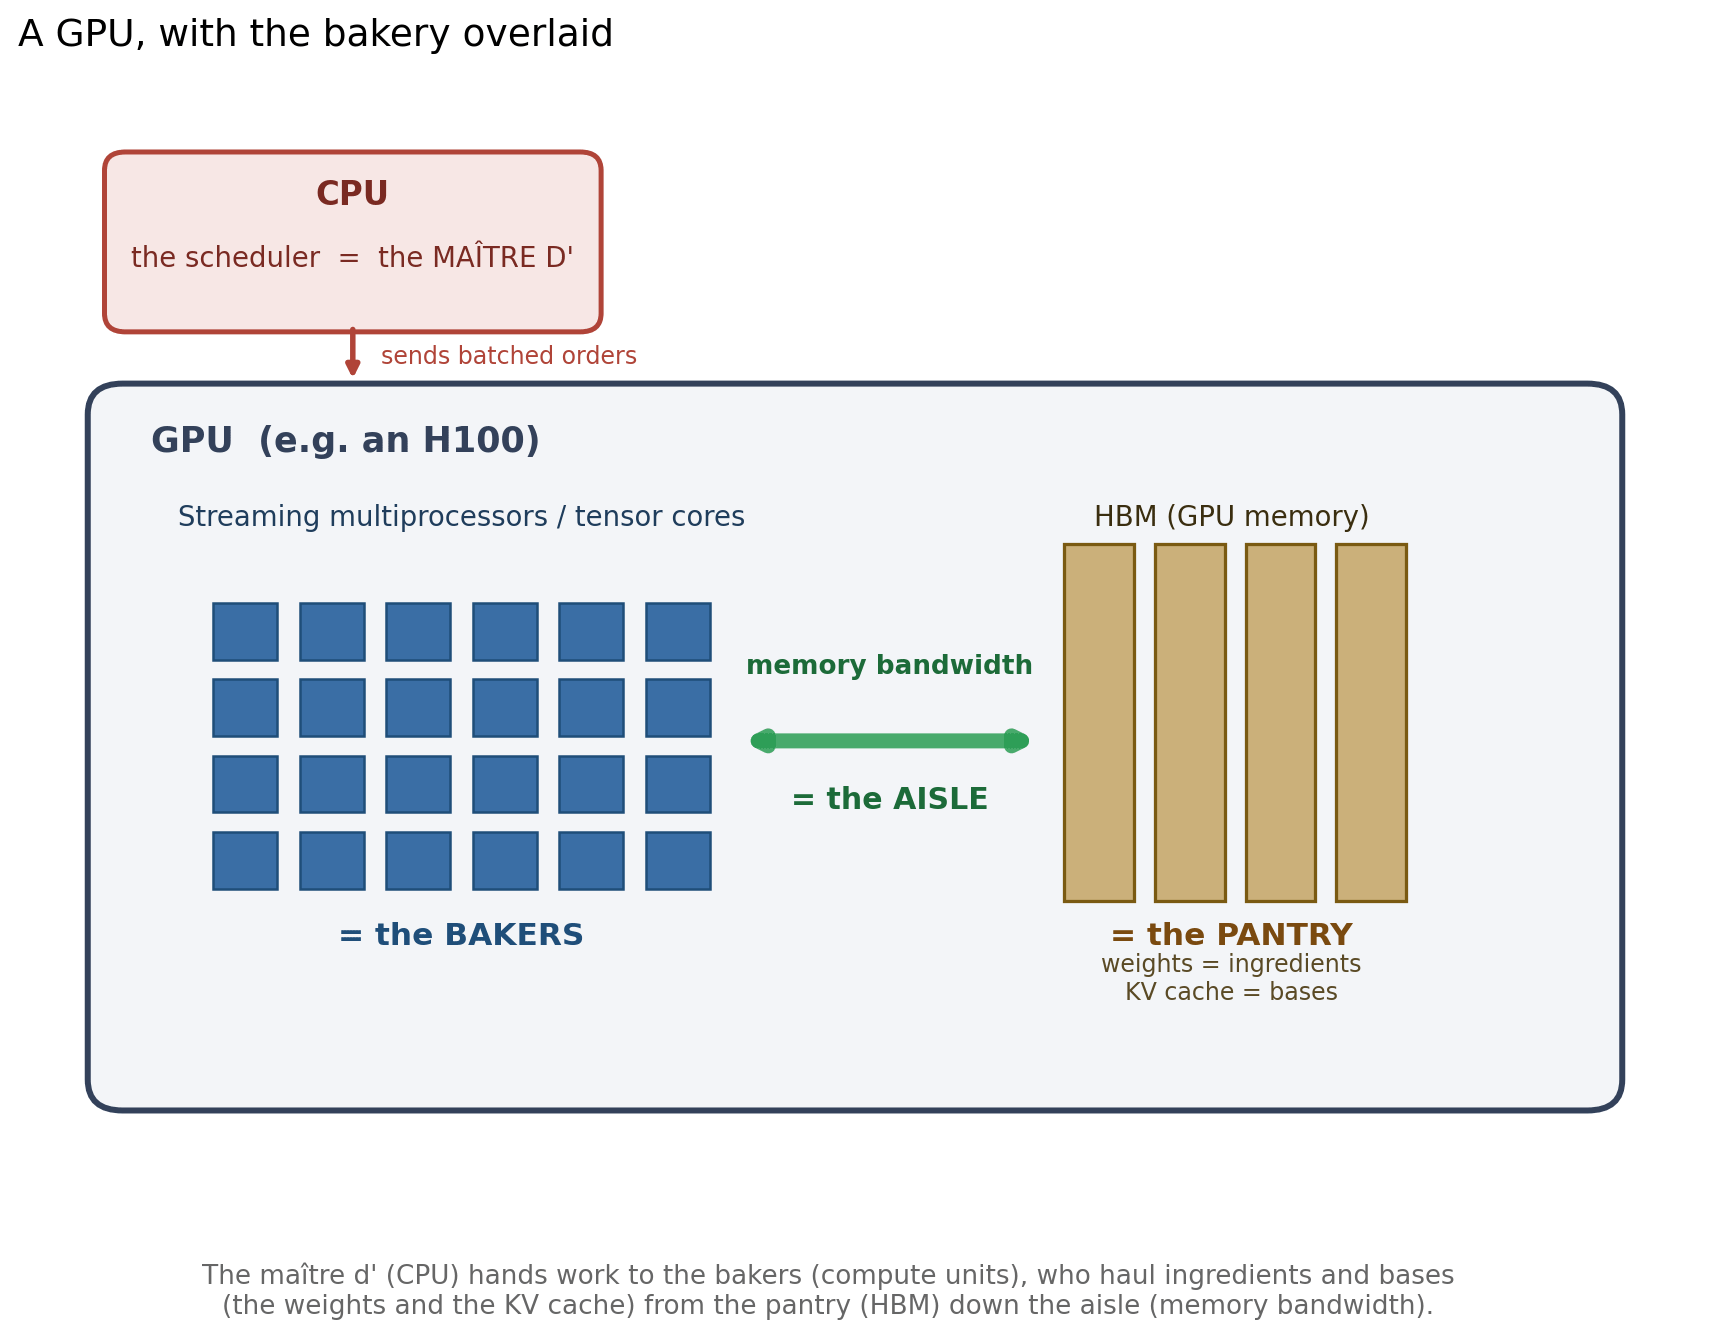
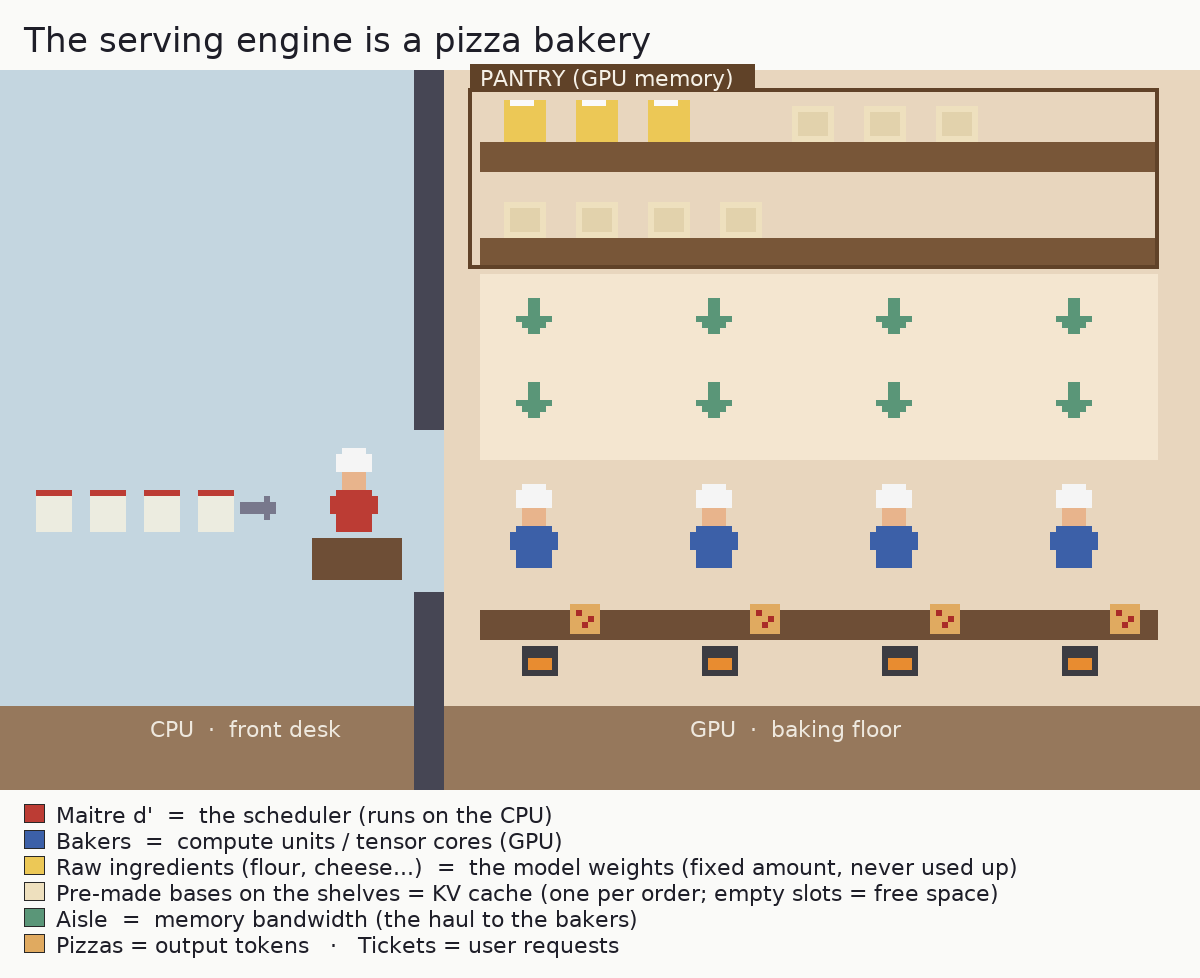
The maître d’ is the scheduler, working the front desk on the CPU. They take incoming orders and decide which bakers work on what, and when. In vLLM this is the scheduler loop: it runs on the CPU and hands batches of work to the GPU.
The bakers are the compute units, on the baking floor (the GPU). There’s a fixed number of them, and they assemble the pizzas. These are the tensor cores doing the matrix multiplications.
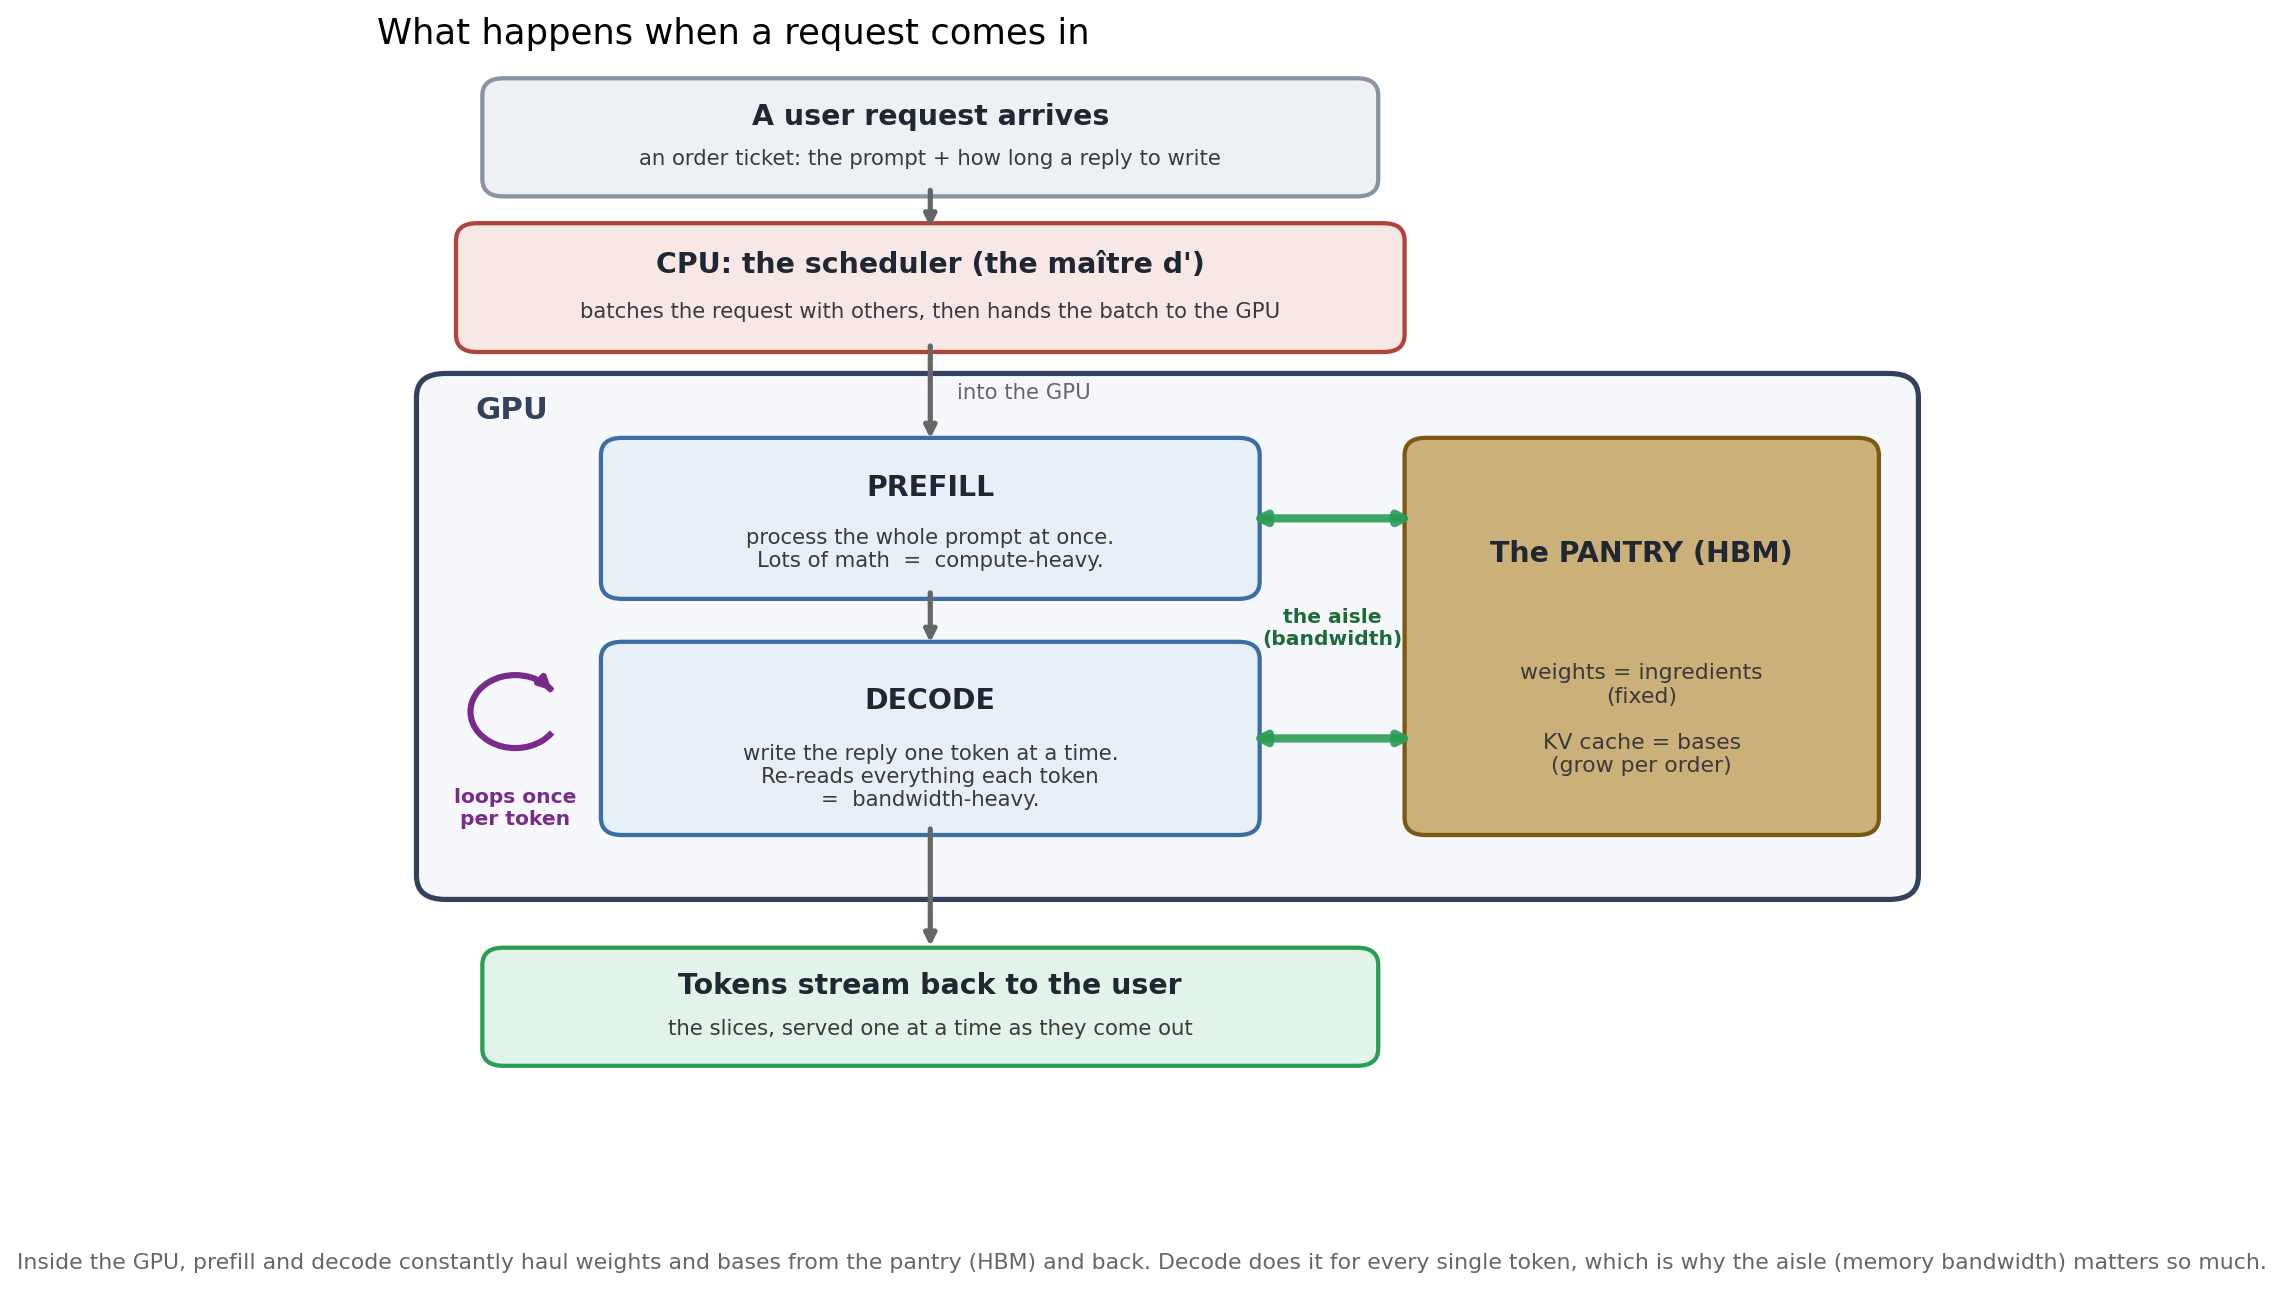
The raw ingredients (flour, cheese, salt, and so on) are the model’s weights, stored in the pantry (the GPU’s memory). There is a fixed amount of them and they take up shelf space. The bakers haul them down the aisle to use on every pizza. Here is the first place a real kitchen would object: in this kitchen the ingredients are never used up. A baker reads them to build a pizza without consuming them, so the pantry stock stays exactly the same size forever, no matter how many pizzas get made.
The pre-made bases are the KV cache, on a shelf in that same pantry. For each order, a baker rolls a base once (the work already done for the tokens seen so far) and keeps it on the counter, so it isn’t re-rolled for every new pizza. Bases are built per order, grow as the order gets longer, and are cleared when the order leaves. This is different memory from the ingredients: a bigger KV cache means more shelf space for bases, not more ingredients.
The aisle is memory bandwidth. Both the ingredients and the bases have to be hauled down the aisle to the bakers. A wider aisle hauls more per second.
The size and complexity of each pizza is the amount of math per token. A loaded pepperoni pizza (a full-precision model) is more work to build than a plain margherita (a model quantized to fp8).
Incoming orders are user requests. The rate at which they arrive is the load on your server.
The serving engine is the management coordinating both rooms: the maître d’ out front on the CPU, the bakers and the pantry in the back on the GPU. A slow kitchen could be any of those resources, and they don’t even live on the same chip.
Here’s the thing that took me a whole experiment to internalize: a kitchen can be slow for four completely different reasons, and the fix for each is different.
The bakers are all busy. Orders flow, the maître d’ keeps everyone fed with work, and still the bakers’ hands are the limit. You’re compute-bound.
Orders pile up but some bakers stand idle. The work exists, it just isn’t reaching the bakers fast enough. The maître d’ is the limit. You’re scheduling-bound.
Bakers stand idle waiting for the haul from the pantry. They finish a slice and then wait on the next load of ingredients and bases coming down the aisle. The aisle is the limit. You’re memory-bandwidth-bound.
There’s no room on the base shelf for a new order. The KV cache is full, so the kitchen can’t start another order until one finishes and frees its base. You’re cache-bound.
If you don’t know which kitchen you’re standing in, you’ll “optimize” the wrong thing. You’ll widen an aisle that wasn’t the holdup, or hire a maître d’ who was already fast enough, and then wonder why nothing got faster. So the entire game is diagnosing which constraint binds. This is the story of me figuring that out for one model on one GPU, the hard way.
The analogy isn’t perfect. It will be very weird to have your pizza delivered one slice at a time.
Why I opened the bakery
I work as a PM on inference serving, and I wanted to pressure-test my mental model of it against real hardware, not slides or benchmarks someone else had run. So I rented a single H100 SXM on Runpod, picked a model that was getting attention (Gemma 4 12B), and set out to benchmark three ways to serve it: plain vllm serve with no flags, the published vLLM “recipe” for the model, and a configuration I’d tune myself.
The one rule I held to: predict before every run, then check. The gap between what I expected and what happened is where the learning lives.
The measurement is a sweep: send requests at a rising rate (1, 2, 4, and so on per second, up to “all at once”) and, at each rate, record how much the kitchen produces (throughput, in tokens/sec) and how long customers wait (latency: time to the first token, and time per token after that).
Step 1: Opening with the default settings (vanilla)
Tried: vllm serve google/gemma-4-12B-it, no flags. The kitchen as it ships.
Saw: First surprise. The “default” kitchen is not a naive one. Out of the box, vLLM already runs an efficient maître d’: chunked prefill (--max-num-batched-tokens 8192), automatic prefix caching, CUDA graphs, and async scheduling (the maître d’ lines up the next batch of orders while the bakers are still finishing the current one, instead of waiting for them to finish before deciding what is next, so the bakers never stand idle between batches), all on by default. Then the sweep drew the shape that every serving system makes. It has three parts:
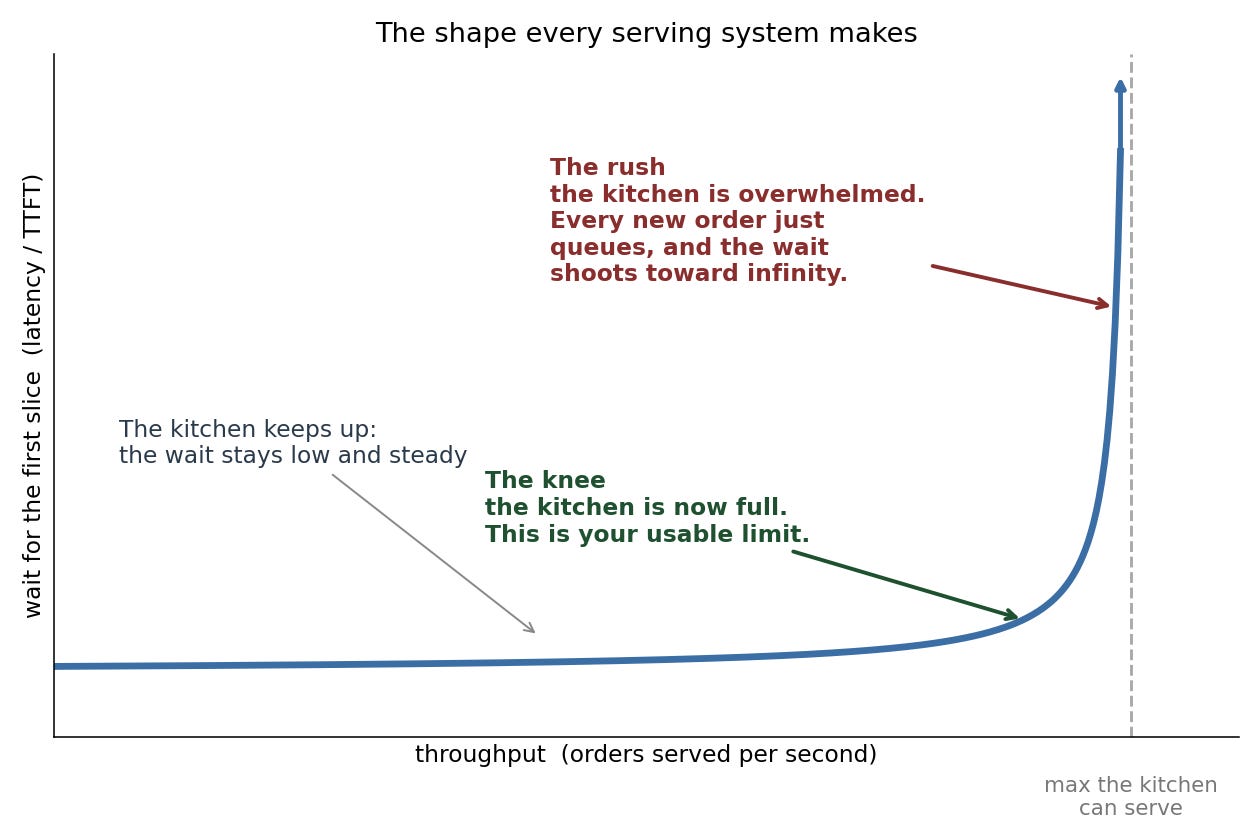
The flat part is the kitchen keeping up: add more orders and the wait barely moves. The knee is where the kitchen fills up, and that bend is your usable limit. Past it comes the rush: the kitchen is overwhelmed, so extra orders don’t get served any faster, they just queue at the door and the wait shoots toward infinity. Here is that shape with my actual numbers:
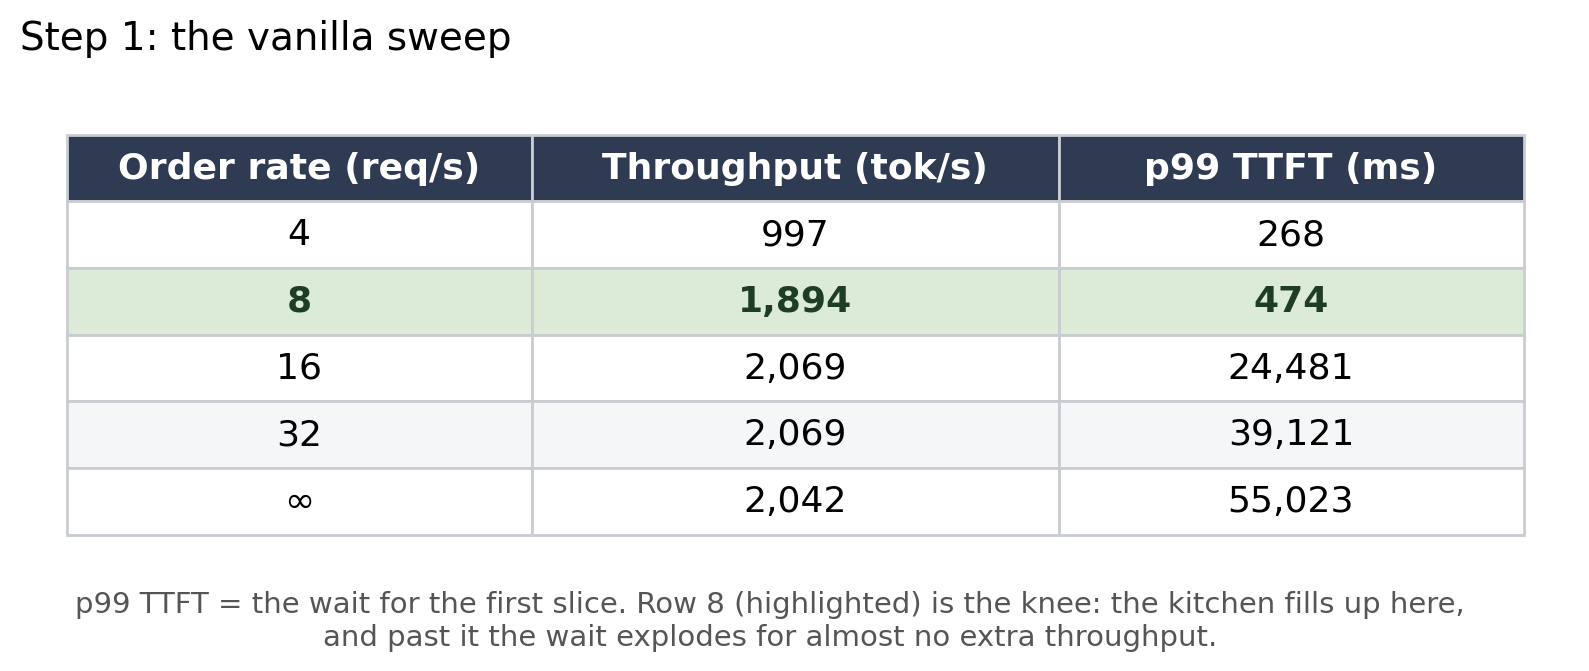
Up to about 8 orders/sec the kitchen keeps up and waits stay low. Past that, output flatlines at ~2,070 pizzas/hour while the wait explodes: 0.5 seconds, then 24, then 55. That flat line is the kitchen at full tilt. The extra orders don’t get made faster, they just queue at the door. The bend where that happens is the knee, and it’s the only throughput number that matters: past it you’re trading a 52x worse wait for a meagre 9% gain.
Calibrated: The decisive clue was in the logs. The base shelf was barely touched. vLLM had reserved room for 1.75 million tokens of pre-made bases (the KV cache, sized by the default --gpu-memory-utilization 0.92), and at full tilt only 5% of it was in use. So the kitchen wasn’t jammed for shelf space. That quietly killed my original plan for the configuration I was going to tune myself, which had been all about that shelf: a bigger cache (--gpu-memory-utilization 0.95) and lighter, compressed bases (--kv-cache-dtype fp8). I’d been about to add shelf space nobody was using.
Outcome: A baseline, a knee at ~8 orders/sec, and a reframed question: if it’s not the base shelf, is it the maître d’ or the bakers?
Step 2: Bringing in a Michelin-starred bakery manager (the published vLLM recipe)
Tried: I brought in a celebrated bakery manager: the published vLLM “recipe” for this model. Despite the name, it is not a cooking recipe. It is a playbook for running the kitchen, a set of recommended settings from people who know this model well.
Saw: Below the knee, identical to vanilla. At the rush, a tantalizing ~5% more throughput. My first instinct was “the playbook helps a little.” Then I read it closely: the playbook set --gpu-memory-utilization 0.90, which is actually below vanilla’s own default of 0.92. That reserves less memory for the base shelf, not more, and the shelf was already 95% empty.
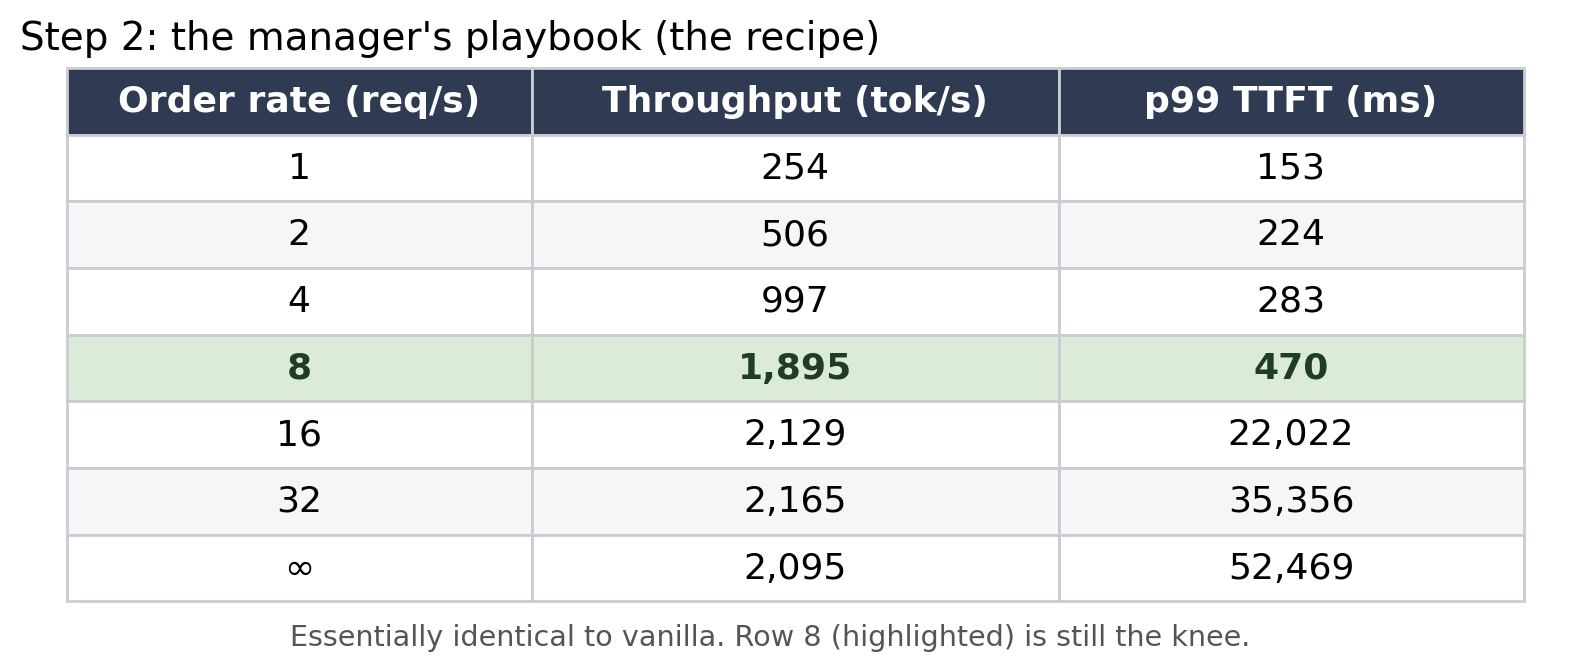
Calibrated: I almost wrote down “+5%” as a win. But these were single runs, and a 5% wiggle at the chaotic peak of the rush is well within noise. The honest move was “I don’t trust this yet,” and I rebuilt my tooling to repeat each run and report the spread. (Spoiler: that 5% later vanished.)
Outcome: The manager’s playbook is about equal to vanilla where it counts. And a rule I’d lean on hard: one run can’t tell signal from noise.
Step 3: Deciding what to actually test (before spending a cent)
Tried: Nothing yet, just thinking. My original “tuned” plan was all about the base shelf: compress the bases so more fit (--kv-cache-dtype fp8, an fp8 KV cache) and reserve more shelf space for them (--gpu-memory-utilization 0.95). Those were the two settings I was sure would give a boost.
Saw: Against Step 1 (base shelf 95% idle), every one of those ideas makes an already-idle resource bigger. They can’t speed up a kitchen the base shelf isn’t holding back.
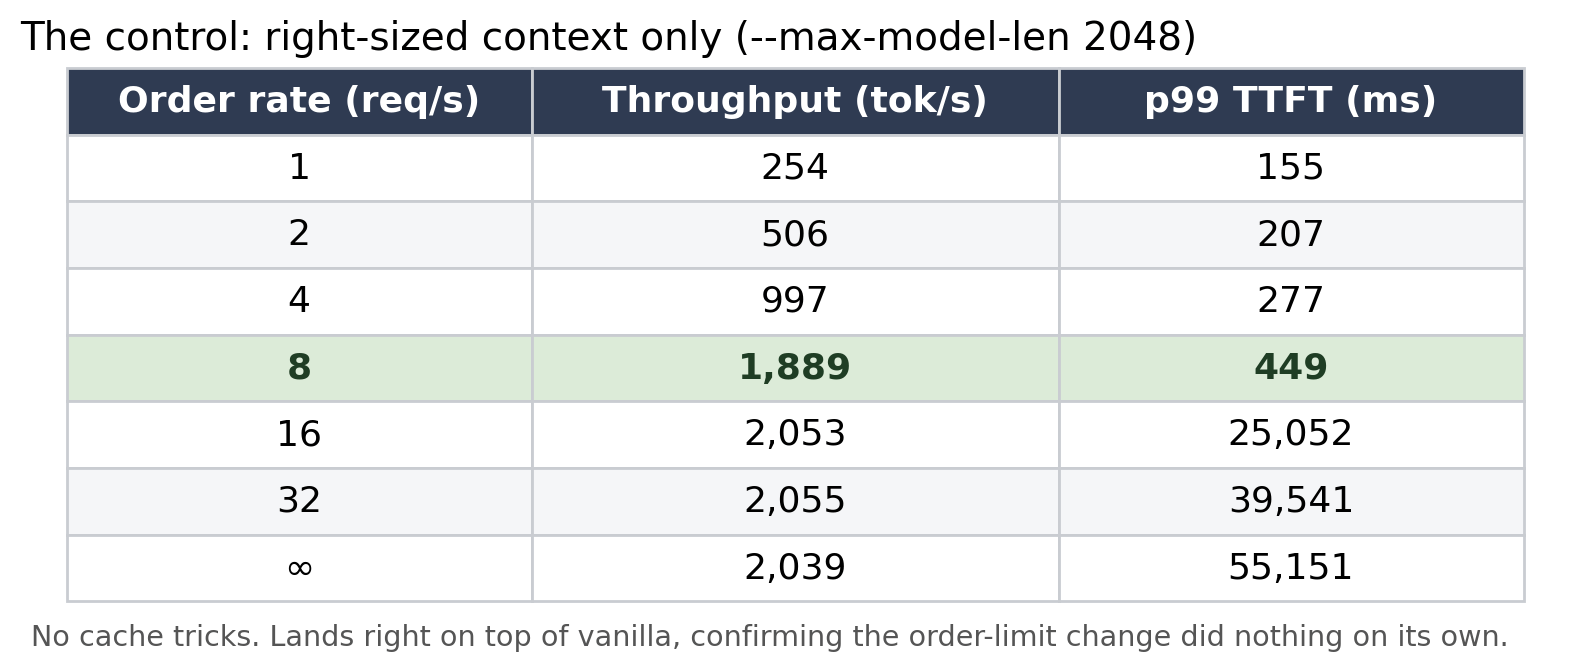
Calibrated: I deleted the whole base-shelf plan by reasoning, without running anything, which was the single biggest time-saver of the project. Then I rebuilt the experiment around a control plus one change at a time. The control is the kitchen run with just a right-sized order limit and nothing else (--max-model-len 2048 --async-scheduling, no cache tricks). It is the honest baseline, and it lands right on top of vanilla, which is the point: right-sizing the order limit changed nothing, so any movement from here is the new setting’s doing, not a side effect. On top of that control I ran two separate experiments, each changing exactly one thing:
Hire a faster maître d’ (control + a bigger scheduler budget,
--max-num-batched-tokens 16384). Does order-flow free up idle bakers?Bake simpler pizzas (control + quantize the weights,
--quantization fp8). Does less work-per-pizza let the bakers clear more?
The control’s own sweep confirms it sits right on vanilla, so the right-sizing changed nothing by itself:
Outcome: A focused plan, a control plus two single-knob experiments, and a reminder that understanding prunes the search space faster than any sweep.
Step 4: Hiring a faster maître d’
Tried: Raise the scheduler’s per-step work budget from the default --max-num-batched-tokens 8192 to 16384 (give the maître d’ more capacity to push orders to the bakers). Three repeats this time.
Saw: Throughput went from 2,055 to 2,103 pizzas/hour, a 2% nudge, but smaller than the run-to-run spread (about ±60 to 100). The “gain” was inside the noise.
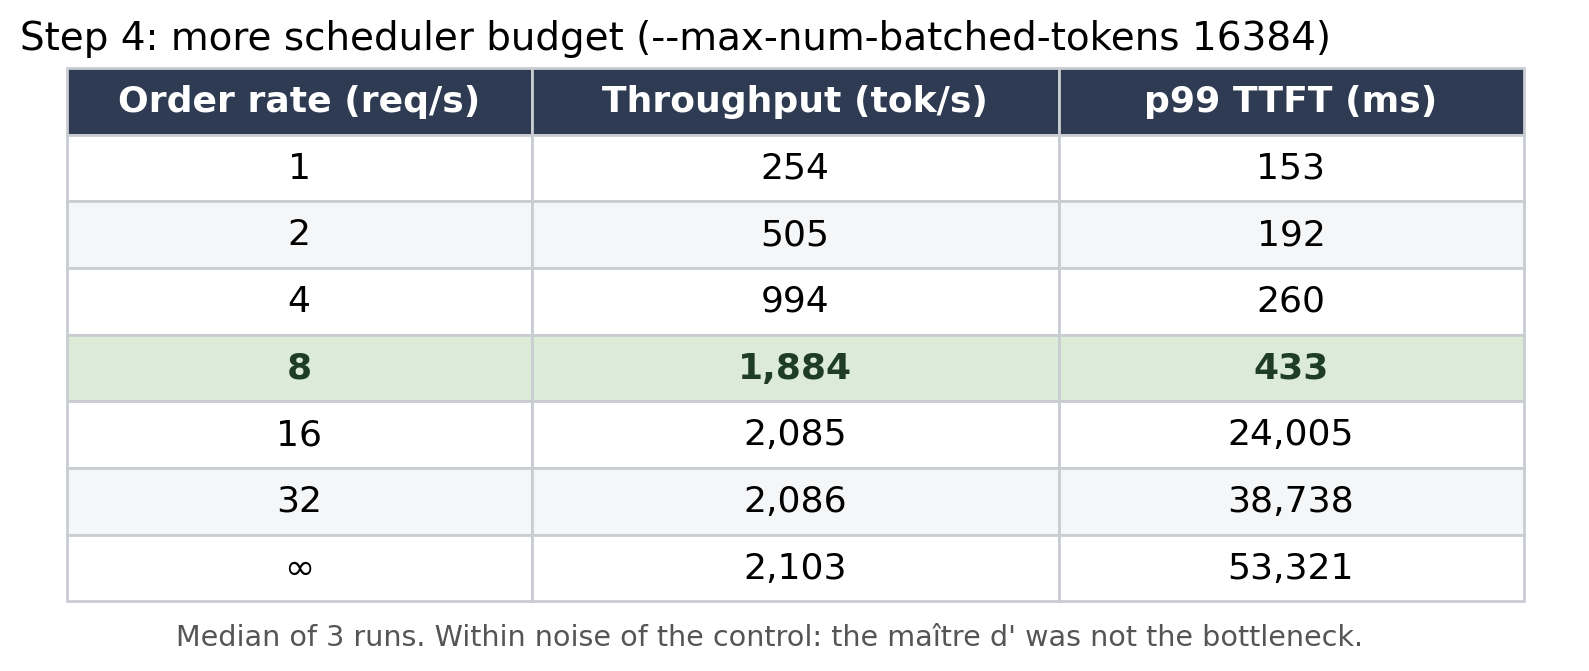
Calibrated: This was a clean negative. The maître d’ was already keeping the bakers fed, so speeding them up changed nothing. The kitchen wasn’t scheduling-bound. By elimination, the suspects were down to one.
Outcome: Not the base shelf, not the maître d’. The bakers themselves.
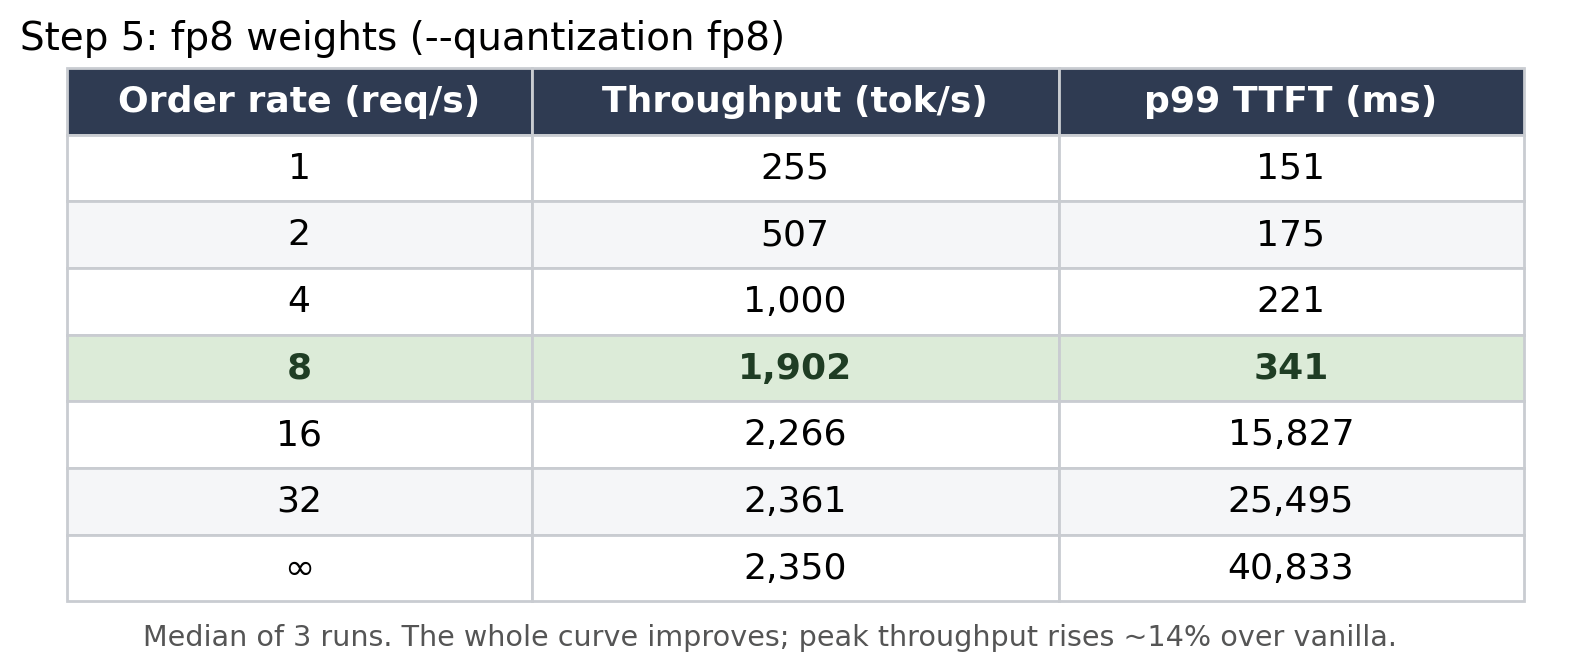
Step 5: Baking simpler pizzas (fp8 weights)
Tried: Switch from pepperoni to margherita. Quantize the model’s weights to fp8 (--quantization fp8), so each token is less math for the bakers. Three repeats.
Saw: Peak throughput jumped to 2,361 pizzas/hour, +14% over vanilla, and the gain was about 5x the noise, so it was unmistakably real. The whole curve shifted down-and-to-the-right: at every load fp8 served at least as many tokens at a lower wait, and it kept gaining throughput from rate 16 out to rate 32, where the full-precision kitchen had already flatlined near 2,070. One honest nuance the numbers force (and the table shows it): the usable knee, where the wait is still low, is still about rate 8 for every config, fp8 included. What fp8 moved is the ceiling past that knee, not the knee itself. So the +14% is a peak-throughput win, best for batch and high-concurrency serving; right at the low-latency operating point, fp8's gift is mostly a shorter wait (341 ms vs 474 ms), not more throughput.
Calibrated: My prediction was right in direction but wrong in size. I’d guessed simpler pizzas would buy 30 to 70%; reality was ~15%. Why? fp8 makes the assembly (the matmuls) cheaper, but the rest of the kitchen (the sauce, the oven time, the parts that aren’t quantized) didn’t get faster. End-to-end, you get far less than the theoretical speedup.
Caveat I still owe: margherita is a different pizza than the one you ordered, but the goal is to ship pizzas irrespective of the toppings.
Quantizing weights changes the model’s output slightly, so the +14% only counts if quality held. Quality spot-check passed.
Outcome: The one change that worked, and it worked precisely because it was the only one aimed at the binding constraint. The bakers were the wall, so the only way through was to give them less to do per pizza.
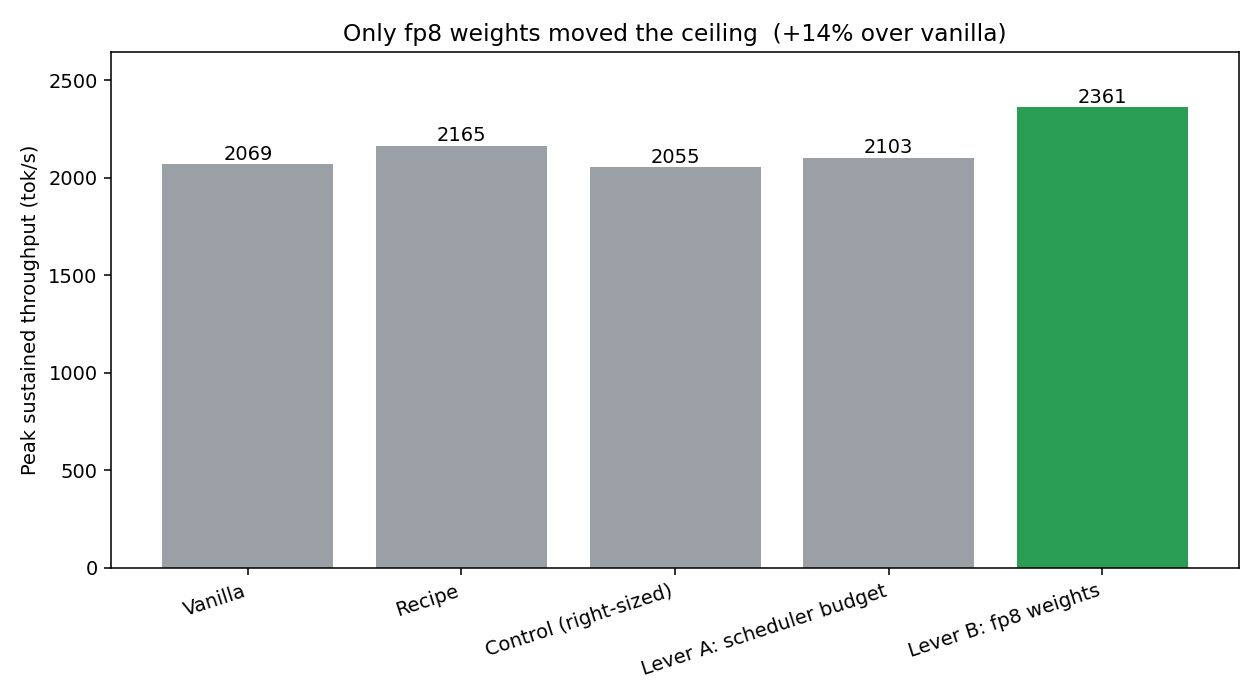
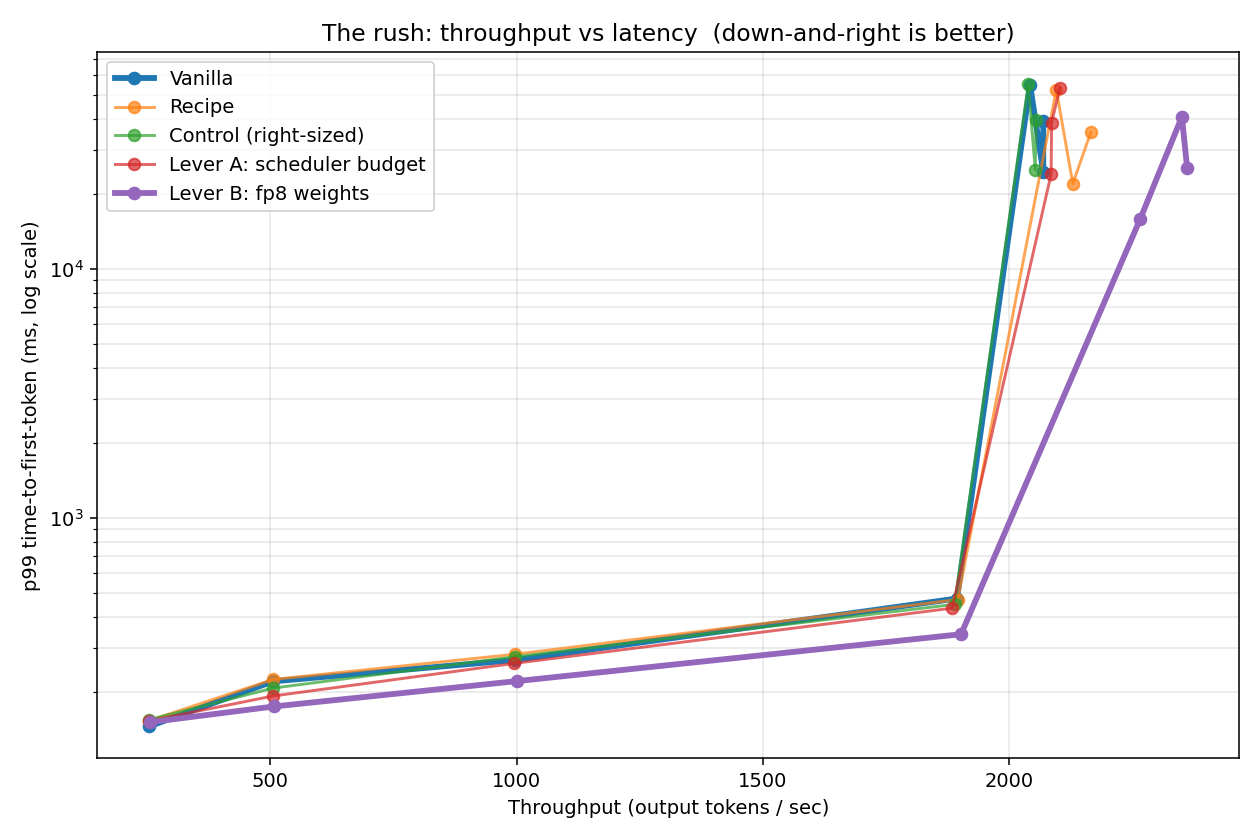
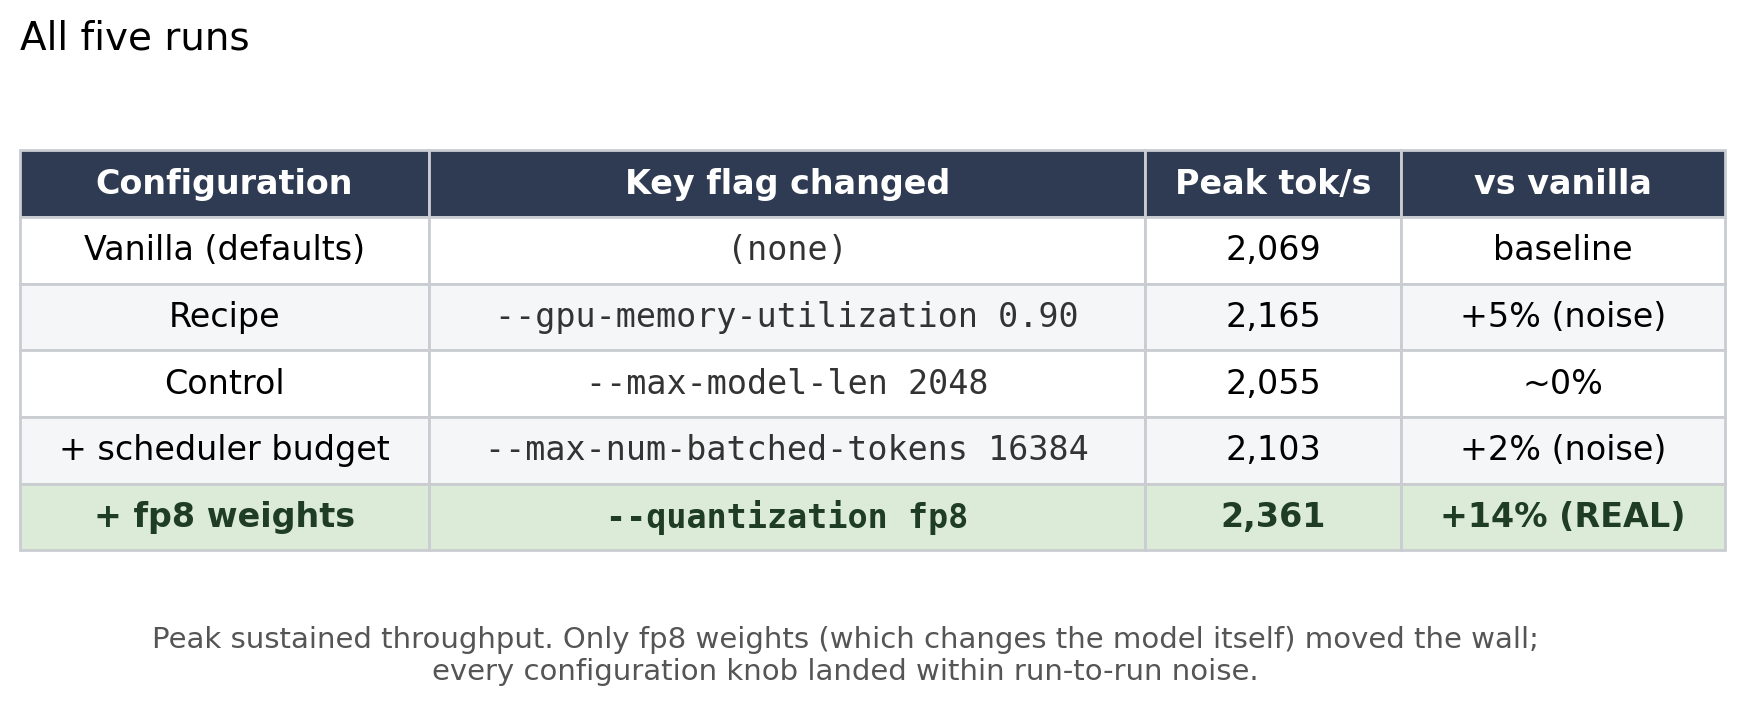
Here are all five runs side by side, with the exact flag each one changed and how it landed:
A fair-comparison caveat, because someone will ask: that “peak” is each config’s ceiling, measured deep in the rush where every one of them is overwhelmed. The wait at those peaks runs 24 to 53 seconds, and each config hits its peak at a slightly different offered rate. So it is a fair ceiling-to-ceiling comparison, but it does not hold latency or concurrency fixed. The properly normalized view is the curve just above (same load sweep for every config), and the strictest version is goodput, throughput under a fixed latency budget. Normalize that way and the story sharpens: under a p99-time-to-first-token budget of 500 ms, all five configs land at about 1,890 tok/s, a tie. So fp8’s +14% is a throughput-regime win, great for batch and offline serving, not a win at a tight latency SLA, where its gift is latency headroom rather than more tokens. (Honest limit: I only sampled rates 8 and 16 around the knee, too coarse to say how much more load fp8 could absorb under that budget. A finer near-knee sweep is the right next measurement.)
The parts of running a kitchen nobody photographs
I sent an order to the wrong kitchen. I ran one experiment’s sweep against the other’s server by accident: an invalid result, a polluted log, and a full re-run. At $3.29/hr for 1 H100SXM with Runpod, the meter runs through your mistakes too.
I felt why nobody brute-forces this. One sweep takes ~19 minutes (the slow orders, at low rates, are also the least informative). A modest grid of settings would be ~80 GPU-hours and ~$270. You don’t grid-search a kitchen; you reason about which station is jammed and test that.
What the kitchen’s own dashboard showed
The GPU telemetry tied a bow on it. The memory read 93% full (the fixed ingredients plus the reserved base shelf), but that’s the shelves being stocked, not the bakers being busy. vLLM grabs all the spare memory for the base shelf the moment it starts, which is why memory looked full while the bases actually sitting on it were 95% unused, and exactly why compressing the bases (--kv-cache-dtype fp8) or adding shelf space (--gpu-memory-utilization) would have done nothing.
If I did this again: searching configs without going broke
I tested a handful of configurations one at a time. A real tuning job has dozens of interacting knobs, and three repeats across seven request rates is about an hour of GPU time per configuration. Brute-forcing even a small grid (say four knobs at three values each) would be roughly 80 GPU-hours and a few hundred dollars. That is hopeless, and it is also unnecessary. Here is how I would keep the cost down next time.
Two-tier sweeps: search cheap, validate expensive. Most of my sweep time was wasted on the low request rates, which take the longest to run (500 requests at 1/sec literally takes 500 seconds to arrive) and tell you the least, because every config looks identical far below the knee. For searching, I would run a stripped-down sweep: about 50 requests, only the rates near the knee, and a hard time cap. That turns a 19-minute sweep into roughly two minutes. The full, rigorous sweep with three repeats and all rates would run only on the two or three finalists that survive the cheap search.
Prune by reasoning before you spend anything. The single biggest saving was not a faster sweep, it was not running one. Diagnosing the bottleneck up front (the base shelf was idle, so cache changes were pointless; the maître d’ was already fast, so scheduler changes were pointless) let me delete entire families of configurations before spending a GPU-minute on them.
Search smart, not grid. Change one knob at a time and watch the curve (coordinate descent), or use Bayesian optimization to find good configs in ten trials instead of dozens. Never sweep the full cross-product of every knob.
Log the cheap signals live so you stop guessing. Recording GPU utilization during a single saturated sweep tells you the binding bottleneck directly, which tells you which knobs could even matter. One good measurement replaces a lot of blind sweeping.
Bring in a heavyweight profiler on the second pass, not the first. I deliberately did not reach for a full profiler (Nsight, the PyTorch profiler) at the start, and the reason is specific: a profiler adds overhead that distorts the very throughput and latency numbers I was trying to measure. You cannot profile the benchmark you are timing without changing it. The cheap signals (vLLM’s own logs and the GPU utilization gauge) plus the change-one-thing perturbation tests were enough to find which resource was binding. Next time, once I know the wall is compute, I would run a profiler in a separate, untimed pass to see which kernels eat the time, for example whether fp8’s gain is capped because attention and the prefill overhead were never quantized. The cheap signals find the bottleneck; the profiler explains it.
Turn the loop itself into a self-driving research agent. Every step above was the same manual cycle: predict, run a cheap sweep, read the bottleneck signal, pick the next single-knob change, repeat. That loop is mechanical enough to hand to an agent: hold the current best config, fire a two-minute search sweep, read the utilization and cache signals to infer the binding resource, propose the next change, and only escalate to a full validated sweep for the finalists. Similar to Karpathy’s autoresearch. I did not build that this time, and that was deliberate: standing up and debugging the automation is its own project, and as someone still new to this, I would have burned far more time and compute getting the harness right than I would have saved by hand. Running it manually first also taught me which signals actually matter, which is exactly what you need to know before you can trust an agent to read them for you. That is where I would take this next, turning days of hand-running into an overnight job.
The meta-lesson: the expensive part of optimization is not the GPU time, it is searching blindly. Understanding is the cheapest optimizer you have.
What I’d try next
The one thing that moved the wall was making each pizza cheaper to assemble (fp8 weights). So the obvious follow-ups are other ways to attack the compute wall:
Speculative decoding. Let a small, fast draft model guess several tokens that the big model verifies in a single pass, so the bakers turn out more slices per trip down the aisle. It mostly helps the decode-bound regime, and it depends on having a good draft model that the big one agrees with often.
Prefill/decode (P/D) disaggregation. Put the two phases on separate GPUs so a big prefill never steals time from in-flight decodes, the head-of-line blocking that chunked prefill only softens. This pays off at multi-GPU scale and on prefill-heavy traffic.
Honest caveat: a 12B dense model on a single H100 may be the wrong testbed for either. Speculative decoding wants a quality draft model in the same family, and P/D disaggregation only earns its keep once you have several GPUs and heavier, more varied traffic. The clean next experiment is probably to rerun this whole loop on a larger or mixture-of-experts model across more than one GPU, where these techniques actually have room to matter.
What I walked away with
The default kitchen isn’t naive. Modern serving stacks ship a competent kitchen and maître d’ already. Read what the defaults do before trying to beat them.
A famous manager’s playbook isn’t tuned for your kitchen. The published settings were, in one place, worse for my workload than doing nothing.
Max throughput is a mirage. Run at the knee. Past it, waits go to 55 seconds for a few percent of throughput nobody can use.
One run can’t separate signal from noise. The playbook’s “+5%” evaporated under repeats; fp8’s “+14%” survived.
For this model and GPU, vanilla was already near-optimal at full precision. Vanilla, the recipe, my right-sized control, and the extra scheduler budget all landed within noise of each other (~2,050 to 2,160 tok/s). No configuration knob moved the wall. The only thing that did was changing the model itself, to fp8 weights. vLLM’s defaults had already left very little on the table for Gemma 4 12B on one H100.
The headline: the one lever that mattered was the one that made the math itself cheaper, and it mattered ~15%, not the 70% I’d hoped. Everything the internet tells you to reach for first did precisely nothing in my kitchen, and the only way to know which was which was to walk in and watch where the line formed.